
How I Ended Up Wrestling with 80K+ Promises
A Deep Dive into Promise Management and Optimization

Let’s face it! sometimes, our Node.js apps behave like unruly teenagers. One minute they’re fine; the next, they’re eating memory like a buffet. Recently, I noticed our AWS ECS Fargate container ballooning in memory usage with a suspicious, repeated pattern.

Figure 1: AWS ECS Service Memory Utilisation Graph
Digging deeper revealed a hidden loop where one of our services sometimes effectively created hundreds of thousands of Promises, an unintentional “promise party” that refused to die.
In this post, I’ll explain how I identified (and finally fixed) that memory fiasco. By the end, you’ll understand exactly why not returning a function properly in an async flow can increase memory usage and ensure you are not summoning an endless horde of unresolved Promises.
How it all started
We had a seemingly stable Node.js monolithic service that occasionally suffered random memory spikes. Over time, these spikes became more frequent, leading to container restarts and increased latency. At first, when they were small, I dismissed them as a “normal traffic surge” or “some random glitch.”
But real trouble surfaced when I noticed these memory spikes happening more frequently, causing random service restarts (Evident in the above memory consumption graph). That’s when I knew something more harmful was happening than normal usage fluctuations.
Key Observations
• Periodic memory increases that never became less intense.
• No immediate smoking gun in the code at first glance.
Initial Thoughts and Steps
Our team initially gathered and started identifying which endpoint or task caused the memory spike. After analysing our logs and memory spike patterns, we identified a cron causing the issue.
Once identified, I tried to replicate this issue on localhost and monitor the memory usage using Chrome DevTools' memory “Allocations on Timeline”. However, I could not recreate the problem, and memory usage was stable for some reason, which was not entirely clear then.
However, I had to recreate the issue in the development environment and obtain heap dumps to dive further.
Heap Snapshots to the Rescue
Heap snapshots capture the memory usage of your app when collecting the snapshot. The process looked like this:
Capturing Snapshots
Since we run in AWS ECS Fargate, I created a small script and connected it to a secured endpoint that generates the .heapsnapshot files using V8’s built-in capabilities. The script uploads these files to a predefined S3 bucket, and I download them locally.
Execute the Cron
I took a heap snapshot before the action to act as the base for the comparison. Another one was taken a couple of seconds after the Cron execution (in which all the promises must have been resolved and garbage collected), and another one was taken after a couple of hours.
Comparing Old vs. New
In Chrome DevTools, I loaded “old.heapsnapshot” (before the spike) and “new.heapsnapshot” (after the spike) and compared them. Immediately, I saw tens (and eventually thousands) of new Promise objects!
After a few hours, the delta was over 83,000. By filtering the “Promise” constructor, I discovered a ridiculous number of newly allocated Promises that never got freed.

Figure 2: Chrome DevTools Heap snapshots comparison
Inspecting Promises
While inspecting and finding the root cause, I discovered that the logging library (Pino) also appeared in every retainer chain. Later, I understood it was just “along for the ride.”

Figure 3: Pino logger in each promise
Takeaway: If you see a library like Pino (or any other) in the chain, don’t blame it blindly. Sometimes, the real culprit is just referencing the same context object.
You must patiently find it. Otherwise, as I suspected the Pino logger, you will suspect a decent function. After all, it was in all the promises.
The Promise Retainers Revealed the Culprit
When I dove into the Chrome DevTools Retainers panel, everything pointed to an endless chain of PromiseReaction objects. Each promise referenced another promise in a “system / Context,” which typically means a loop of async calls.
In simpler terms, something in the code was:
Spawning new Promises,
Never letting them resolve (or they were failing repeatedly),
Then piling them up in memory.

Figure 4: Chain of promiseReactions
Because the reference chain always included code retrying an operation, I suspected an auth token refresh logic or an error handler that recursively re-called itself.
Two Major Issues I Identified
The refresh token logic of a service we highly use in the project included incorrect implementations.
Issue 1: Not Returning the Recursive Call
// WRONG CODE
private async handleService<T>(promise: () => Promise<{ data: T }>): Promise<T> {
  try {
    return await promise;
  } catch (err) {
    if (err.code === 'TOKEN_EXPIRED') {
      await refreshToken();
      // Recall the handle service again to retry.
      handleService(promise);
    } else {
      throw err;
    }
  }
}
Because there’s no return on the recursive call, the outer function never receives the eventually resolved value. This can lead to indefinite re-calls if the token never truly updates.
// Correct CODE
private async handleService<T>(func: () => Promise<{ data: T }>): Promise<T> {
  try {
    return await promise;
  } catch (err) {
    if (err.code === 'TOKEN_EXPIRED') {
      await refreshToken();
      return handleService(promise);
    } else {
      throw err;
    }
  }
}
Issue 2: Using Pre-Created Promise Instead of a Function
When the token expires, refreshToken() gets triggered to update the headers. But in the following code, the Promise is created before we call handleService for the second time. Since the Promise was already instantiated with outdated headers, it never access the refreshed headers. As a result, the call repeatedly fails with the expired token.
function service() {
  const oldHeaders = { Authorization: 'ExpiredTokenXYZ' };
  const promise = makeRequest('/api', oldHeaders);
  return handleService(promise);
}
The solution is to pass a function reference that generates the request, rather than the request Promise itself.
Validating the Fix
After updating the code to pass a function reference (and ensuring that every recursive call returns properly):
Memory Stabilized: The mass of Promises gradually disappeared in subsequent heap snapshots.
No More “Expired Token” Loop: Newly added logs showed successful token usage, instead of spamming the same error.
No Restarts: ECS Fargate containers stopped restarting unexpectedly, saving time and reducing downtime.
I confirmed this by capturing a fresh snapshot after the fix and comparing it to the previous one. The delta in Promise counts virtually vanished, proving our changes resolved the root issue.
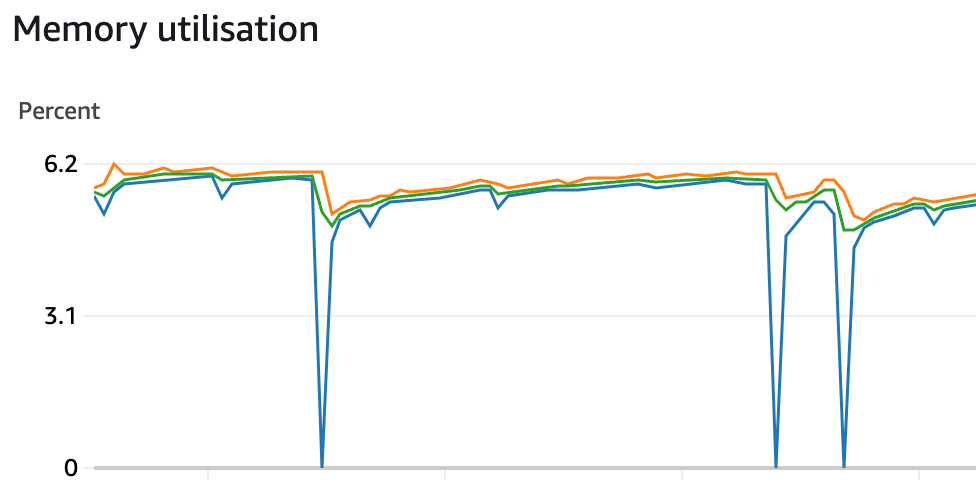
Figure 4: AWS ECS Service Memory Utilisation Graph (After fixing the issue)
Note: Above figure shows the current memory usage of the development environment. These zero memory usages are expected because they were recorded during deployments.
Lessons Learned
Always Return Recursive Calls: Missing a single return can lead to a subtle yet dangerous loops of pending Promises.
Pass Functions, Not Pre-Created Promises: If you need fresh state (like updated headers), passing a function reference ensures your code re-creates the request with the latest data.
Cap Your Retries: Even if you do everything right, an endlessly failing token or misconfiguration can still loop forever. Always enforce a maximum number of retries.
Heap Snapshots Are Invaluable: Take snapshots at different times to pinpoint whether objects are genuinely leaking or just briefly in use.
Beware of Over-Simplified Suspicions: Seeing the same library (like Pino) in every retainer chain does not necessarily mean it’s the source of the leak. It’s often just a shared context.
Monitor Logs & Metrics: If you see the same error repeated thousands of times, it’s probably a sign of an internal loop or repeated failure.
good article
Dear Sir, what best practices can developers follow to avoid similar promise-related memory issues in large-scale applications? Really good work, sir! Inspiring!! Keep up with your curiosity, sir.