
Solving a Sneaky Next.js Memory Leak
Practical debugging tactics any engineer can apply

Yesterday, fresh off a New Year break, while I was gearing up for a regular sprint, QA engineers burst into the scrum saying, “Bad Gateway everywhere!” A quick dive into the AWS console showed my QA containers repeatedly restarting after gobbling up their memory limits. Dev wasn’t far behind.
Oh yes. My first thought was Great, here we go again. Another “promise party” gone wild. But this time the drama was in Next.js, not my usual backend playground.
I’m not going to explain all the previous Memory Leaks related learnings. If you are interested, check out my “How I Ended Up Wrestling with 80K+ Promises” post.

Figure 1: Sudden Memory Spikes on 10th of April 2024
Key Observations 🔍
Inspecting the Development environment showed that every few hours the container hit its memory ceiling and restarted.
This started to happen in the latest release. It was as calm as a sea (With occasional small minor waves obviously) before.
Only 10‑12 devs were poking the environment nowhere near enough traffic to down a service.
Memory increased with occasional drops, which didn’t rush me to conclude this was a memory leak.
Initial Steps - Isolating the Problem 🔬
I still was not sure whether this was a memory leak or what caused this. So I did the following.
I pointed the Application Load Balancer at a dedicated /api/health endpoint.
Ensured no one was accessing the Development environment (Zero traffic removes user behaviour from the equation).
Keep inspecting the AWS ECS Container memory usage for a couple of hours.
These steps isolated the issues to a narrow area with the following learnings.
Page requests initiated this memory leak. How? When no one was accessing the development environment, memory usage was at the minimum. Even with the new Health Check Endpoint. But as soon as devs started to access the environment, the usual crashing started with rapid memory climbs.
It was never a good idea to provide a Page to ALB health check. Why? It was an honest mistake. For all the other micro frontends, we have made separate health check APIs but forgot to update the one with this incident. According to AWS, health checks should be lightweight to avoid excessive load or delays, which implies building a dedicated API endpoint.
Usual Friend for the Rescue 🤝
After the initial steps, I wrote a small script to stream the heap snapshots using octet streams which were quite convenient for me rather than uploading to an S3 bucket. With a couple of security checks, this endpoint was created.
import { NextRequest } from 'next/server';
import path from 'path';
import { v4 as uuid } from 'uuid';
import v8 from 'v8';
import fs from 'fs/promises';

export const GET = async (request: NextRequest) => {
  if (request.headers.get('x-key') !== process.env.HEAP_SECRET_KEY) {
    return new Response('Heapdump is not available.', { status: 403 });
  }

  if (typeof v8.writeHeapSnapshot !== 'function') {
    return new Response('Heap snapshot function is not available.', { status: 500 });
  }

  const fileName = `fe-heapdump-${Date.now()}-${uuid()}.heapsnapshot`;
  const filePath = path.join('/tmp', fileName);

  try {
    v8.writeHeapSnapshot(filePath);
    const fileBuffer = await fs.readFile(filePath);
    await fs.unlink(filePath);

    return new Response(fileBuffer, {
      status: 200,
      headers: {
        'Content-Type': 'application/octet-stream',
        'Content-Disposition': `attachment; filename="${fileName}"`,
      },
    });
  } catch (error) {
    return new Response('Heap snapshot creation failed.', { status: 500 });
  }
};
For a period of time, these heap snapshots were collected to compare.

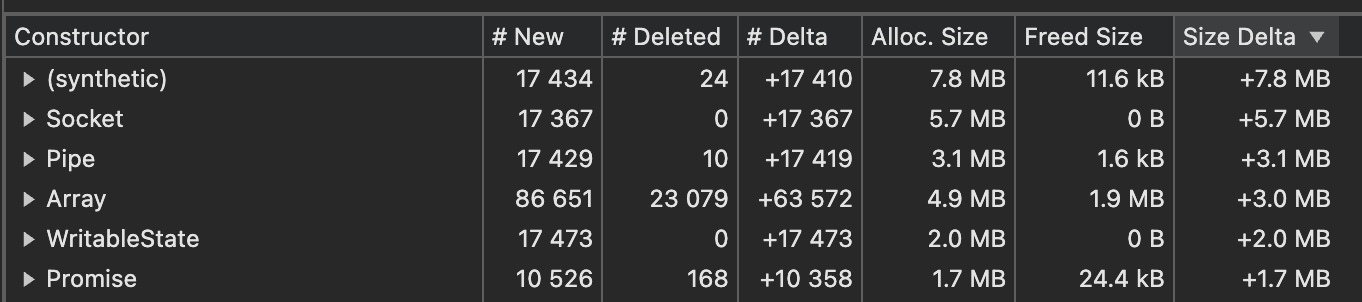
Figure 2: Heap Snapshot Comparison
As expected, these snapshots concluded this is indeed a memory leak.
Why? Focus on the #New and #Deleted columns. See the most of the newly created Items are not being deleted in these two heap snapshots. If you check the #Delta column—the delta between creations and deletions—it clearly showed the memory is not being freed.
Should it? It should be when no one is using the system and these created and unused objects should be garbaged collected. But these piling-up objects clearly indicate a memory leak.
Inspecting the Summary of the Latest Snapshot 🕵🏻♂️

Figure 3: Summary of the latest heap snapshot in Chrome DevTools
Inspecting the Summary of the recent snapshot showed that the Compiled Code and Strings have the highest retained sizes but these two can be safely ignored because they are Internal objects rather than user-created ones.
What? Memory profiling tools (such as those used for JavaScript/V8), items like compiled code and strings are shown inside brackets to denote that they are internal or engine-provided classes. So that developers can quickly identify which objects might be the source of high memory usage and have been introduced by the application code rather than the JS Engine.
Here, the Compiled code is the result of the engine’s JIT compilation process and this particular string class is managed in the engine.
Since the Sockets had the highest Size Delta as shown in the Figure 2, I started to inspect the Sockets and could find the culprit after carefully inspecting a couple of objects using the retainers section.
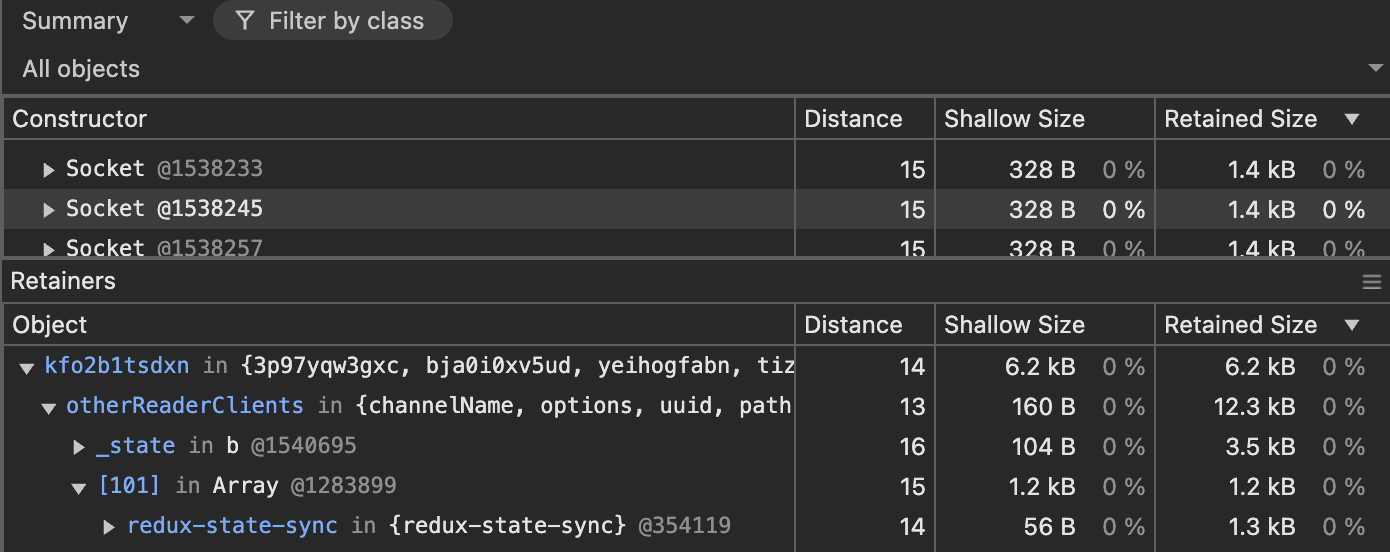
Figure 4: Identify the potential culprit
As you can see, our team has recently introduced a library called redux-state-sync for a feature and there it was. This should be the culprit right? I did not rush to conclude but checked their GitHub issues section and found out this memory leak is a known issue in that Library.
Removal of this library and redeployment with careful inspection for a couple more hours with usual usage of the system ensured that the memory spiking issue is resolved now.

Figure 5: Low usage after the leak fix
Proving a Point (Warning: Contains Technical Jargon) 👨🏻💻
Now, back to clear out my initial observation. Why did the container crash when the ALB repeatedly hitting the server?
Redux is set up in Next.js by creating a new store per server request—ensuring isolation—and then rehydrating that state on the client so it persists across client-side navigation. This method lets certain redux state slices to survive in page reloads with the integration of redux-persist.
However, after inspecting the redux-state-sync library for a few minutes, I identified a potential memory leak that can arise from the library. In there, the developer repeatedly attach global event listeners (without appropriate cleanup) on every store creation or module reload. Since the Next.js Redux integration recreates the store in each request, this causes the number of active listeners to grow unbounded over time, which eventually exhausts memory and may crash the server.
Reassurance 🙌
Since we are using Code Rabbit (My next post is about this 😁), I added a new path instruction to always validate newly added libraries by searching for known performance/security issues. This now ensures if there are any kind of known issue of a newly installed package, this will get flagged in the PR itself.
Wrapping Up 🚀
In the end, this event wasn’t just another “promise party” hangover—it was a reminder that small oversights can snowball into production‑level chaos.
By isolating traffic, using lightweight health‑checks, and utilising on‑demand heap snapshots, I traced the leak back to an innocent‑looking library and shut it down before it kill more sprint time.
So, if your containers start chugging RAM like there’s no tomorrow:
Strip your health checks to the bare minimum.
Automate snapshot collection early
Validate every new dependency
Shipping code is easy; shipping healthy code is the real flex.
🚀🖤